January 20, 2026/
Most macroeconomic analysis lives at one of two extremes: This project sits somewhere in the middle. I wanted a clear,...
As options traders and learners, we often talk about the Greeks — delta, gamma, theta, vega, rho, and their second-order cousins like vanna and vomma. But rarely do we get to see how they behave in real time.
I built this fully interactive, educational dashboard using Python and Streamlit to help visualize and better understand how these risk measures respond to changing market conditions.
The goal?
To create something I could use both as a personal learning tool and to share with others who want to explore options sensitivity in a hands-on, visual way.
YouTube demo: here
GitHub: link to GitHub
The dashboard was built using:
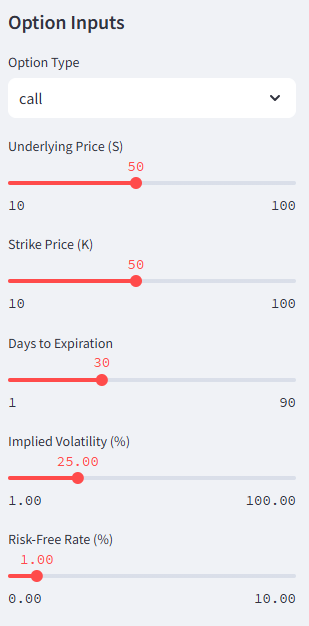
Streamlit for a responsive web interfacePlotly for interactive 2D and 3D chartsNumPy and SciPy for Black-Scholes calculationsAll of the Greek calculations — including second-order measures — are built from scratch using analytical formulas. This makes the tool fully transparent and easily extendable. The tool allows for users to toggle parameters to observe sensitivities and relationships
You can view:
Each Greek can be displayed:
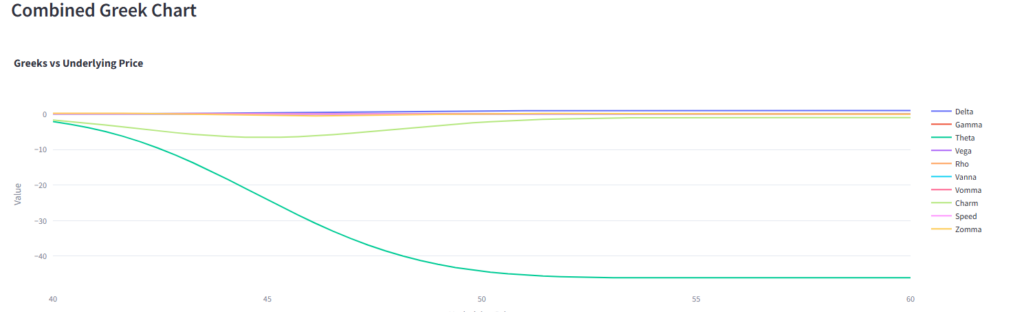
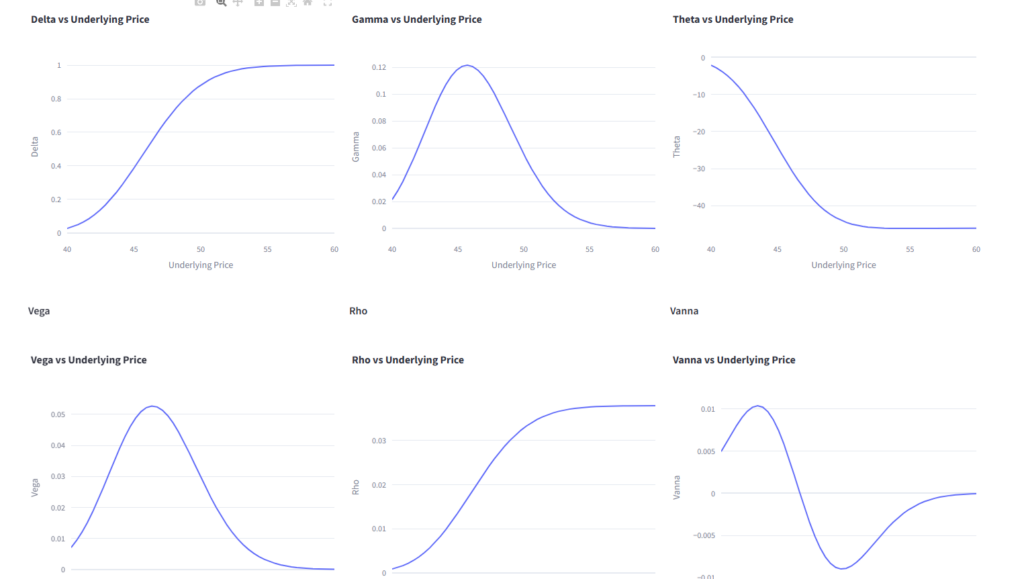
This makes the dashboard ideal for spotting patterns, training your eye, or demoing how Greeks behave around key price levels.
Toggle the “3D Surface Plots” option to bring up:
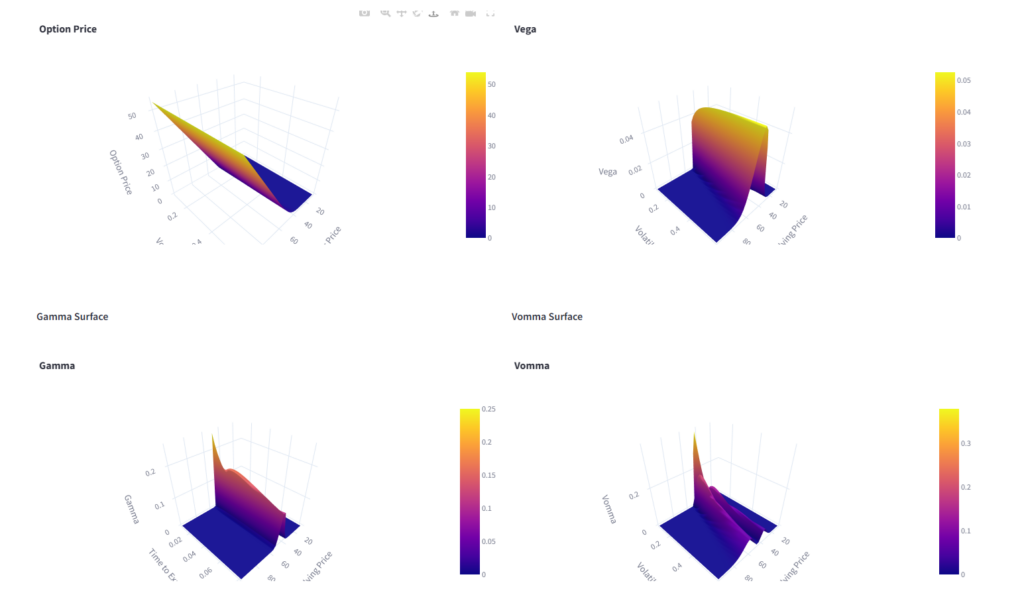
These charts help visualize how option values and sensitivities shift as a function of both price and volatility or time.
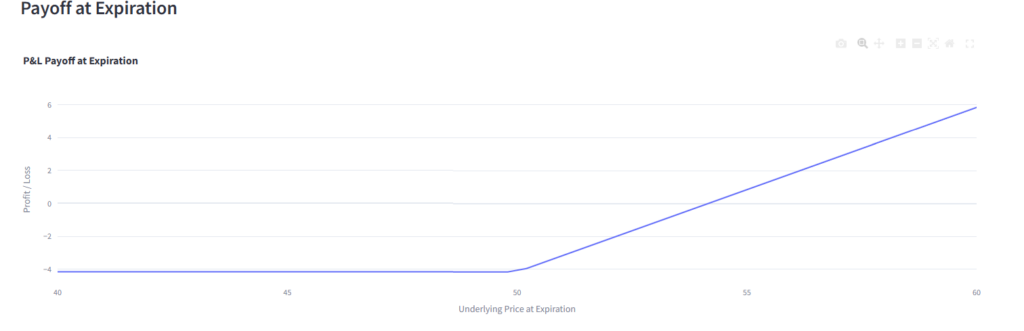
The dashboard also includes a payoff diagram that updates dynamically as you adjust the underlying price, strike, and other variables — offering a quick snapshot of the profit/loss outcome at expiration.