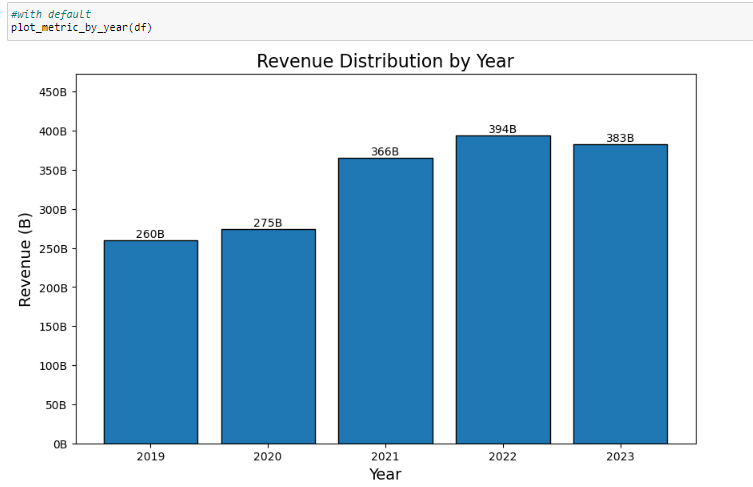
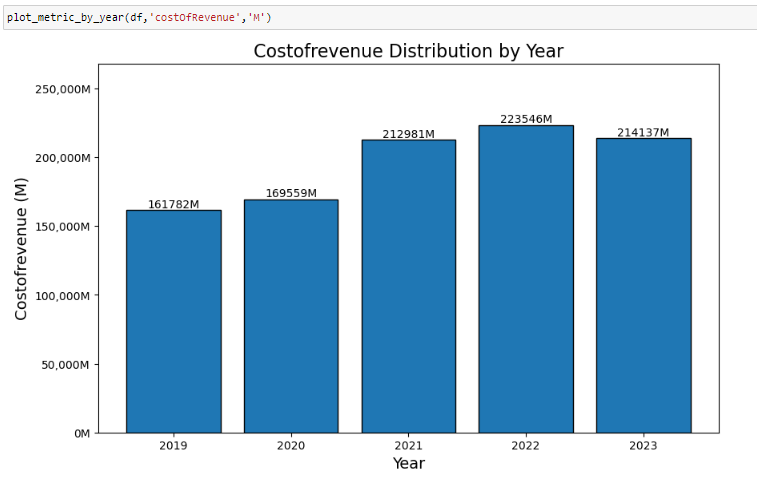
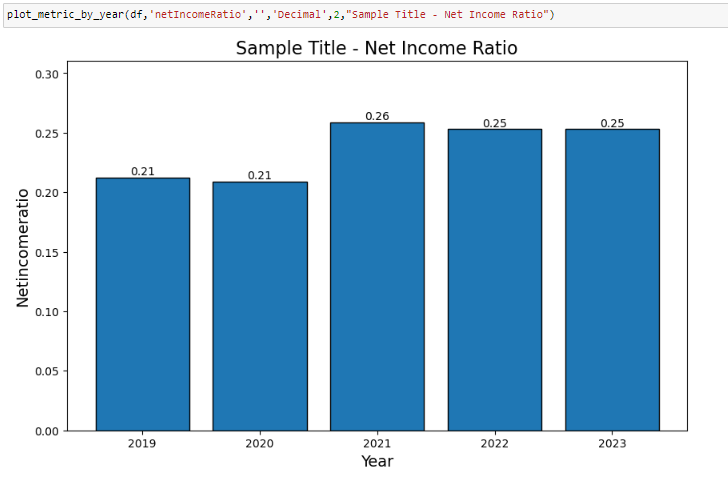
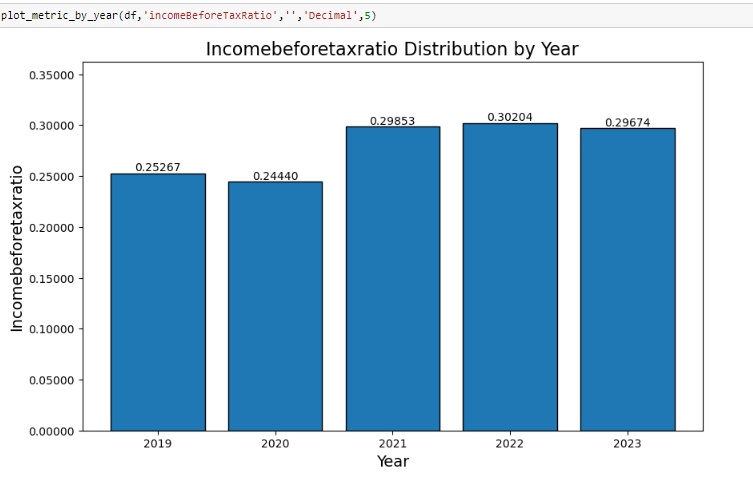
I am only going to show a few lines of code here. The functions being called are in the notebook. We are going to get data from FMP (Income Statement in this example) and then we are going to chart a few of the metrics.
Financial Modelling Prep (FMP) has a great API that I use for my analysis. You can obtain an API key here.
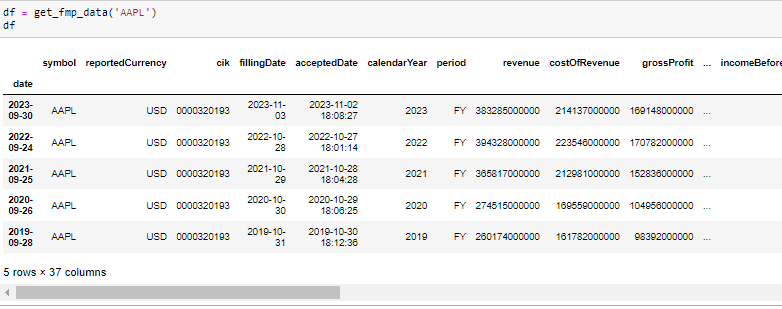
Get Income Statement For Apple
Please note: the get_fmp_data defaults to income statement, but can pull the following
‘income-statement’: This retrieves the income statement of the company.
‘balance-sheet-statement’: This retrieves the balance sheet of the company.
‘cash-flow-statement’: This retrieves the cash flow statement of the company.
‘profile’: This retrieves the company profile information.
‘key-metrics’: This retrieves key metrics of the company.
‘key-metrics-ttm’: This retrieves key metrics on a trailing twelve months basis.
‘ratios-ttm’: This retrieves ratios on a trailing twelve months basis.
‘earning-calendar’: This retrieves the earnings calendar information for the company.
In addition, it takes annual/quarterly as parameters and yes/no for formatting. The formatting helper function is more fore the pyxll related project and if using this notebook use ‘no’.