January 20, 2026/
Most macroeconomic analysis lives at one of two extremes: This project sits somewhere in the middle. I wanted a clear,...
In Part I, we compared rule-based vs reinforcement learning (RL) trading strategies on AAPL using a 2-year backtest of daily data. Now, we’re scaling that idea across all 500+ tickers in the S&P 500.
What happens when we apply the same logic to the entire market?
We keep the same seven models and run a uniform backtest across all tickers. Our goal: uncover which models are consistently effective, which sectors they perform best in, and where RL models can offer an edge over traditional strategies.
| Model | Top 2 Count | Top 2 % |
|---|---|---|
| Model0 (Rule SMA) | 220 | 43.7% |
| Model4 (RL) | 183 | 36.4% |
| Model1 (RL) | 153 | 30.4% |
| Model2 (RL) | 146 | 29.0% |
| Model5 (Mean Reversion) | 123 | 24.5% |
| Model3 (RL) | 122 | 24.3% |
| Model6 (RL Mean Reversion) | 59 | 11.7% |
Insight:
Model0 (simple SMA rule) remains the most consistently high-ranking model. However, RL models like Model4 and Model1 are not far behind — showing strong adaptability in certain sectors.
| Sector | Model0 | Model1 | Model2 | Model3 | Model4 | Model5 | Model6 |
|---|---|---|---|---|---|---|---|
| Communication Services | 12.50 | 12.64 | 9.53 | 8.52 | 10.85 | 12.11 | 5.50 |
| Consumer Discretionary | 18.00 | 9.08 | 8.72 | -0.34 | 7.53 | 3.15 | 3.21 |
| Consumer Staples | -2.44 | -5.05 | -1.61 | -4.98 | -6.42 | -0.75 | 0.26 |
| Energy | 17.86 | 11.53 | 11.95 | 3.94 | 12.33 | 8.50 | -0.52 |
| Financials | 26.76 | 15.29 | 13.91 | 11.29 | 19.28 | 8.70 | 1.78 |
| Health Care | -0.46 | -2.89 | 0.71 | 2.68 | 1.73 | -2.53 | -0.47 |
| Industrials | 19.07 | 13.18 | 12.08 | 9.92 | 12.15 | 8.94 | 1.06 |
| Information Technology | 16.49 | 10.59 | 11.58 | 7.16 | 20.11 | 7.69 | 0.04 |
| Materials | 8.13 | -3.48 | 4.56 | 2.64 | 4.10 | 5.82 | -2.54 |
| Real Estate | 6.48 | 0.86 | 4.41 | 4.01 | 8.92 | 9.02 | 2.14 |
| Utilities | 16.52 | 11.25 | 13.75 | 8.69 | 18.34 | 1.04 | -2.92 |
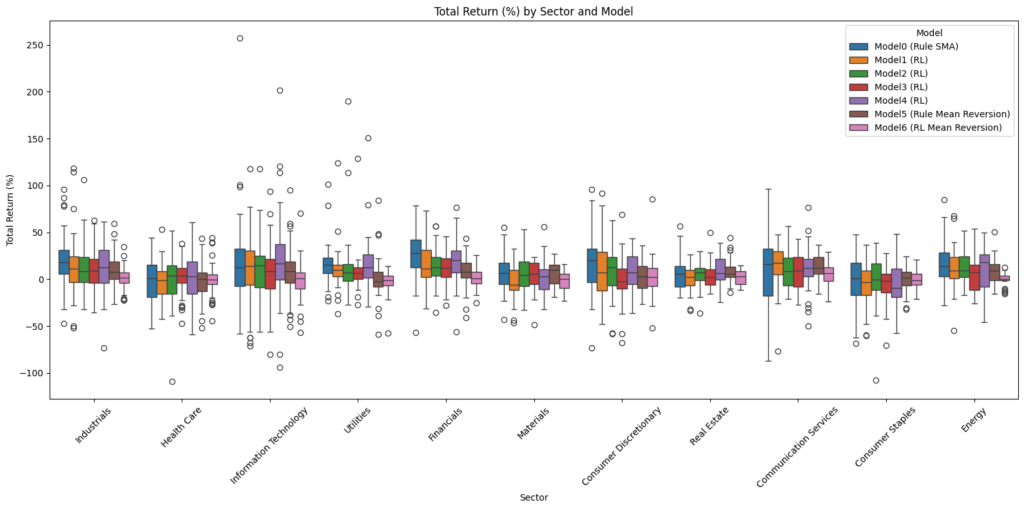
Insight:
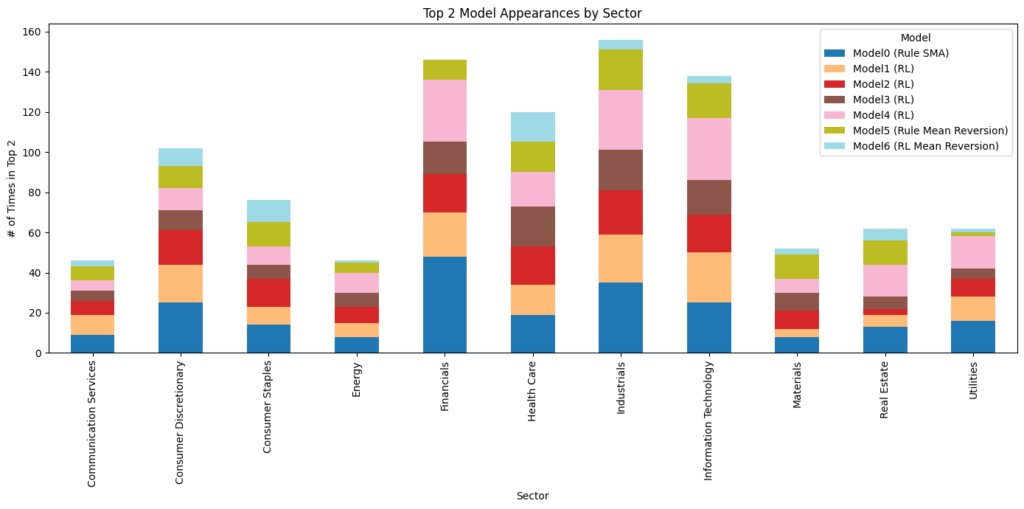
| Sector | M0 | M1 | M2 | M3 | M4 | M5 | M6 |
|---|---|---|---|---|---|---|---|
| Communication Services | 9 | 10 | 7 | 5 | 5 | 7 | 3 |
| Consumer Discretionary | 25 | 19 | 17 | 10 | 11 | 11 | 9 |
| Consumer Staples | 14 | 9 | 14 | 7 | 9 | 12 | 11 |
| Energy | 8 | 7 | 8 | 7 | 10 | 5 | 1 |
| Financials | 48 | 22 | 19 | 16 | 31 | 10 | 0 |
| Health Care | 19 | 15 | 19 | 20 | 17 | 15 | 15 |
| Industrials | 35 | 24 | 22 | 20 | 30 | 20 | 5 |
| Information Technology | 25 | 25 | 19 | 17 | 31 | 17 | 4 |
| Materials | 8 | 4 | 9 | 9 | 7 | 12 | 3 |
| Real Estate | 13 | 6 | 3 | 6 | 16 | 12 | 6 |
| Utilities | 16 | 12 | 9 | 5 | 16 | 2 | 2 |
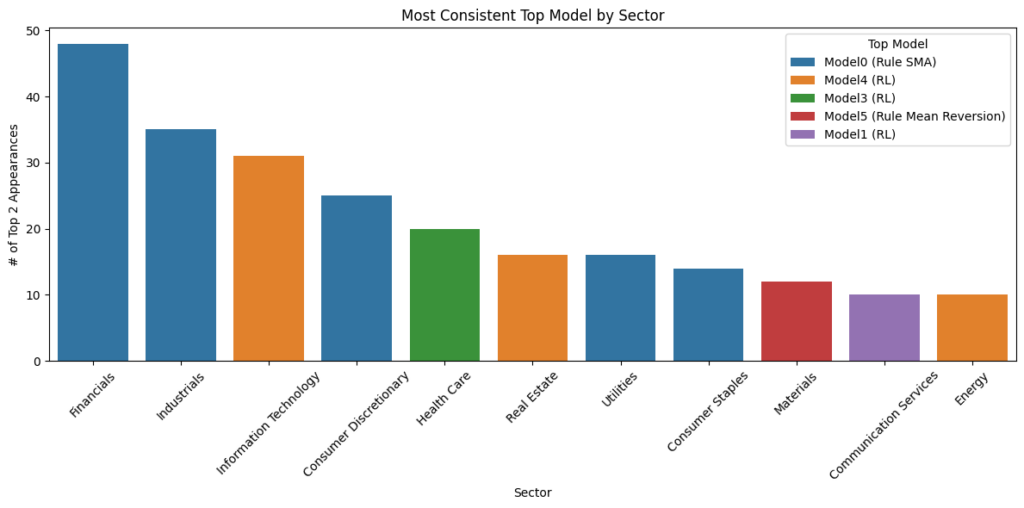
| Sector | Top Model | Top Model Count |
|---|---|---|
| Financials | Model0 (Rule SMA) | 48 |
| Industrials | Model0 (Rule SMA) | 35 |
| Information Technology | Model4 (RL) | 31 |
| Consumer Discretionary | Model0 (Rule SMA) | 25 |
| Health Care | Model3 (RL) | 20 |
| Real Estate | Model4 (RL) | 16 |
| Utilities | Model0 (Rule SMA) | 16 |
| Consumer Staples | Model0 (Rule SMA) | 14 |
| Materials | Model5 (Rule Mean Reversion) | 12 |
| Communication Services | Model1 (RL) | 10 |
| Energy | Model4 (RL) | 10 |
| Sector | Best Model | Avg Return (%) |
|---|---|---|
| Financials | Model0 (Rule SMA) | 26.76 |
| Information Technology | Model4 (RL) | 20.11 |
| Industrials | Model0 (Rule SMA) | 19.07 |
| Utilities | Model4 (RL) | 18.34 |
| Consumer Discretionary | Model0 (Rule SMA) | 18.00 |
| Energy | Model0 (Rule SMA) | 17.86 |
| Communication Services | Model1 (RL) | 12.64 |
| Real Estate | Model5 (Rule Mean Reversion) | 9.02 |
| Materials | Model0 (Rule SMA) | 8.13 |
| Health Care | Model3 (RL) | 2.68 |
| Consumer Staples | Model6 (RL Mean Reversion) | 0.26 |
In Part III, we’ll visualize all of these results using a Streamlit dashboard, where you can explore model performance by sector, ticker, or metric — all with just a few clicks.
GitHub Link to notebook: GitHub