January 20, 2026/
Most macroeconomic analysis lives at one of two extremes: This project sits somewhere in the middle. I wanted a clear,...
I’ll demonstrate the following tasks:
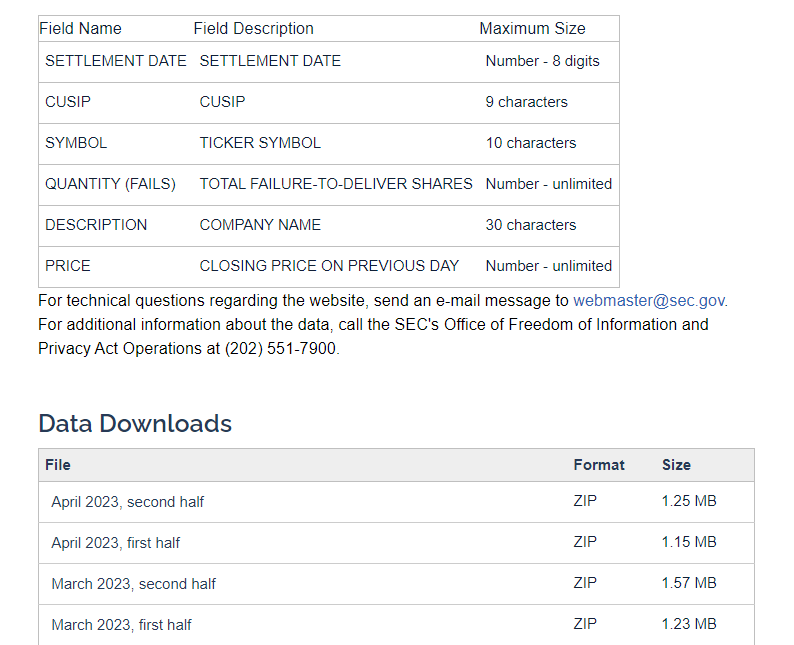
Background information on FTDs and the site we will be using can be found below
A copy of the notebook can be found here: Github
This shows the data/structure of the data and how the website is organized
# Download every FTD Folder

import os
import requests
from urllib.parse import urljoin
from bs4 import BeautifulSoup

url = "https://www.sec.gov/data/foiadocsfailsdatahtm"

#If there is no such folder, the script will create one automatically
folder_location = r'C:\FTDs'
if not os.path.exists(folder_location):os.mkdir(folder_location)

response = requests.get(url)
soup= BeautifulSoup(response.text, "html.parser")
for link in soup.select("a[href$='.zip']"):
# for link in soup.find_all('a'):
    #Name the pdf files using the last portion of each link which are unique in this case
    filename = os.path.join(folder_location,link['href'].split('/')[-1])
#     print (filename)

    #check to see if file exists or not before saving
    if os.path.isfile(filename):
        print (filename + "already exists")
    else:
        with open(filename, 'wb') as f:
f.write(requests.get(urljoin(url,link['href'])).content)import zipfile, os
working_directory = folder_location
os.chdir(working_directory)
for file in os.listdir(working_directory): # get the list of files
if zipfile.is_zipfile(file): # if it is a zipfile, extract it
with zipfile.ZipFile(file) as item: # treat the file as a zip
item.extractall() # extract it in the working directory# importing the library
import os
import pandas as pd
# control parameters for below. Change here as needed
startPeriod = 20200101 # YYYYMMDD
tickerList = ["AAPL"]
# giving directory name
dirname = folder_location
# giving file extension
ext = ('.txt')
# iterating over all files
df_final = pd.DataFrame(columns=['SETTLEMENT DATE','CUSIP','SYMBOL','QUANTITY (FAILS)',
'DESCRIPTION','PRICE'])
for files in os.listdir(dirname):
if files.endswith(ext):
# print(files) # printing file name of desired extension
# print(dirname + "/" + files)
# print(files.Path())
# print(dirname+files)
# df = pd.read_csv(dirname + "/" + files)
# df.head()
df = pd.read_csv(dirname + "/" + files,sep='|', encoding='ISO-8859-1',on_bad_lines='skip')
# only run for certain years
sub_df=int(df.iloc[0]['SETTLEMENT DATE'])
if sub_df>=startPeriod: #YYYYMMDD
df = df[df['SYMBOL'].isin(tickerList)] #Filter by ticker symbol
# print (df)
df_final = pd.concat([df_final, df],join="inner")
else:
continue
print ("Done!")
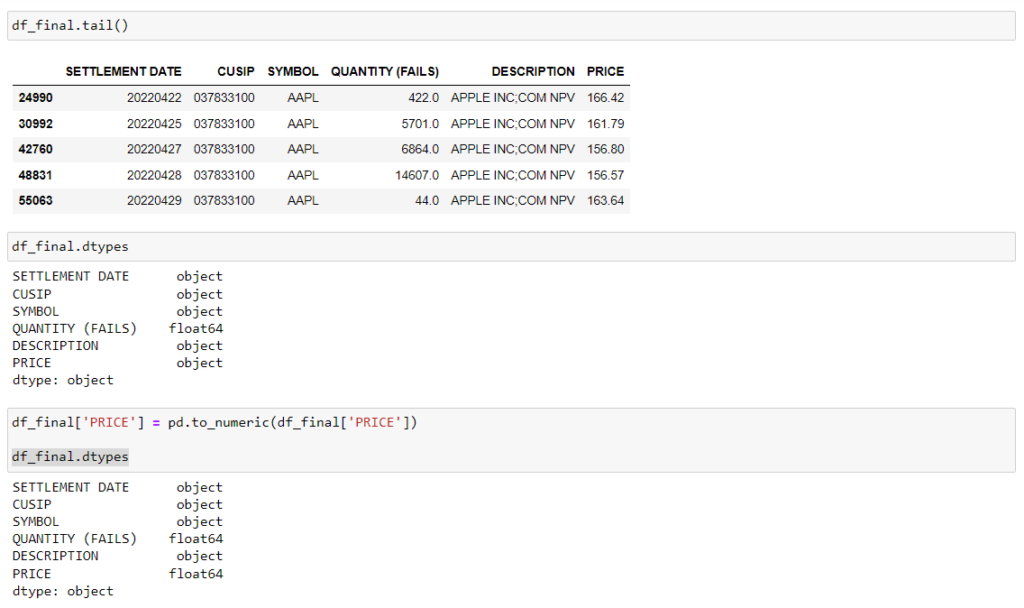
Note that price in this exploration is listed as an object. We need to convert this to a number for charting purposes later.
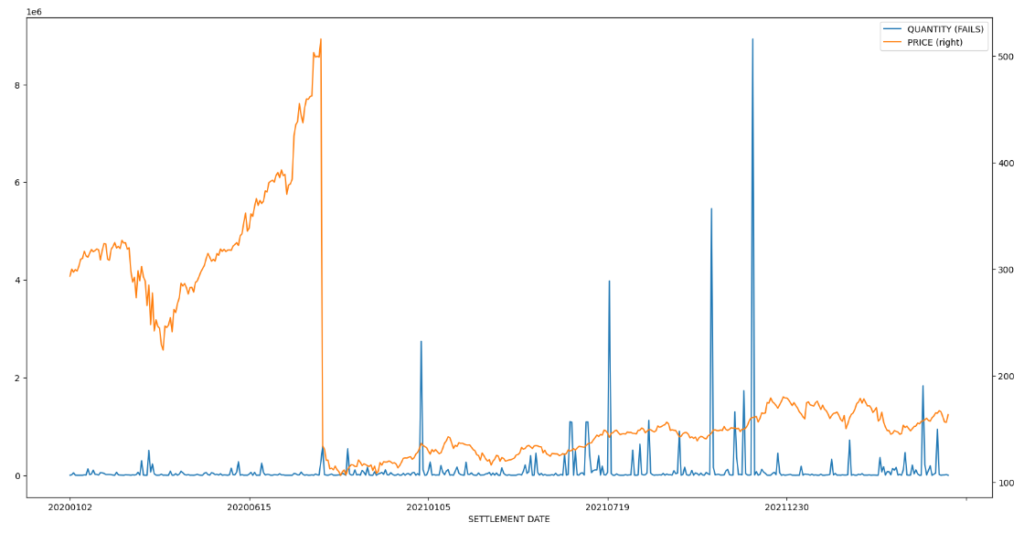
import matplotlib.pyplot as plt

# df = pd.read_csv("review_ftd.csv")
df = df_final

fig, ax = plt.subplots(figsize=(20,10))

df.plot(x = 'SETTLEMENT DATE', y = 'QUANTITY (FAILS)', ax = ax)
df.plot(x = 'SETTLEMENT DATE', y = 'PRICE', ax = ax, secondary_y = True)