January 20, 2026/
Most macroeconomic analysis lives at one of two extremes: This project sits somewhere in the middle. I wanted a clear,...
I am going to show how to create a python screener that pulls OHLC data from Yahoo Finance and then calculates buy/sell signals for the following indicators. Please note: the three bullets below are Investopedia links should you need more information
# import libraries
import yfinance as yf
import pandas as pd
from datetime import datetime, timedelta
# Define the symbols and date range
symbols = ['MMM', 'AAPL', 'GOOGL']  # Example list of symbols
start_date = '2022-12-01'

# Get the current date
current_date = datetime.today()
end_date = (current_date - timedelta(days=1)).strftime('%Y-%m-%d')

# Create an empty list to store the results
results = []

# Loop over each symbol
for symbol in symbols:
    # Fetch OHLC data from Yahoo Finance
    data = yf.download(symbol, start=start_date, end=end_date)

    # Calculate SMA
    period = 20
    data['SMA'] = data['Close'].rolling(window=period, min_periods=20).mean()

    # Calculate RSI
    period = 14
    delta = data['Close'].diff()
    gain = delta.where(delta > 0, 0)
    loss = -delta.where(delta < 0, 0)
    avg_gain = gain.rolling(window=period).mean()
    avg_loss = loss.rolling(window=period).mean()
    relative_strength = avg_gain / avg_loss
    data['RSI'] = 100 - (100 / (1 + relative_strength))

    # Calculate Bollinger Bands
    period = 20
    std_dev = data['Close'].rolling(window=period).std().shift(1)
    data['Upper Band'] = data['SMA'] + 2 * std_dev
    data['Middle Band'] = data['SMA']
    data['Lower Band'] = data['SMA'] - 2 * std_dev

    # Calculate Signal columns
    data['SMA Signal'] = ''
    data['RSI Signal'] = ''
    data['BB Signal'] = ''

    data.loc[data['SMA'] > data['Close'], 'SMA Signal'] = 'Sell'
    data.loc[data['SMA'] < data['Close'], 'SMA Signal'] = 'Buy'
    data.loc[data['SMA'] == data['Close'], 'SMA Signal'] = 'Neutral'

    data.loc[data['RSI'] > 70, 'RSI Signal'] = 'Sell'
    data.loc[data['RSI'] < 30, 'RSI Signal'] = 'Buy'
    data.loc[(data['RSI'] >= 30) & (data['RSI'] <= 70), 'RSI Signal'] = 'Neutral'

    data.loc[(data['Close'] < data['Lower Band']) & (data['RSI'] < 30), 'BB Signal'] = 'Buy'
    data.loc[(data['Close'] > data['Upper Band']) & (data['RSI'] > 70), 'BB Signal'] = 'Sell'
    data.loc[((data['Close'] >= data['Lower Band']) & (data['Close'] <= data['Middle Band'])) | ((data['Close'] <= data['Upper Band']) & (data['Close'] >= data['Middle Band'])), 'BB Signal'] = 'Neutral'

    # Calculate Buy, Sell, and Neutral Signal counts
    data['Buy Signal'] = (data['SMA Signal'] == 'Buy').astype(int) + (data['RSI Signal'] == 'Buy').astype(int) + (data['BB Signal'] == 'Buy').astype(int)
    data['Sell Signal'] = (data['SMA Signal'] == 'Sell').astype(int) + (data['RSI Signal'] == 'Sell').astype(int) + (data['BB Signal'] == 'Sell').astype(int)
    data['Neutral Signal'] = (data['SMA Signal'] == 'Neutral').astype(int) + (data['RSI Signal'] == 'Neutral').astype(int) + (data['BB Signal'] == 'Neutral').astype(int)

    # Add the symbol and its data to the results list
    results.append({'Symbol': symbol, 'Data': data})

# Convert results to dataframes
dataframes = []
for result in results:
    symbol = result['Symbol']
    data = result['Data']
    dataframe = pd.DataFrame(data)
    dataframe['Symbol'] = symbol
    dataframes.append(dataframe)

# Combine all dataframes into a single dataframe
combined_dataframe = pd.concat(dataframes)
# combined_dataframe.head(35)

# Sort by Symbol and then Date descending
combined_dataframe.sort_values(by=['Symbol', 'Date'], ascending=[True, False], inplace=True)

# Display the combined dataframe
combined_dataframe.head()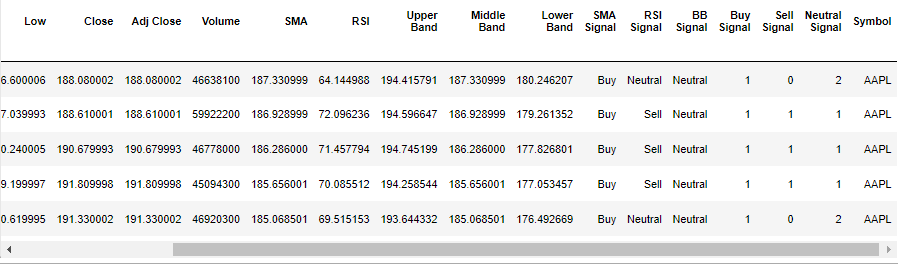
# Sort the combined_dataframe by 'Symbol' and 'Date'
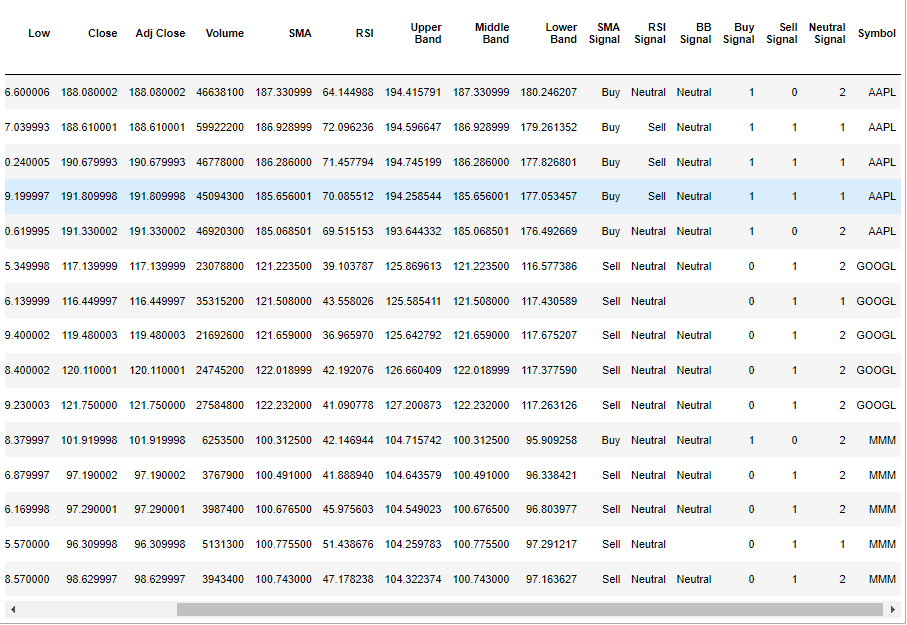
sorted_dataframe = combined_dataframe.sort_values(by=['Symbol', 'Date'], ascending=[True, False])
# Extract the most recent 5 days of data per ticker
grouped_dataframe = sorted_dataframe.groupby('Symbol').head(5)
print("Most recent 5 days of data per ticker:")
grouped_dataframe